What’s new in version 3
Version 3 of SQLWATCH brings several, long-awaited features that should make your SQL Server monitoring easier and better.
Grafana Dashboard
The history of SQLWATCH goes back to around 2010, when it was just a bunch of scripts and agent jobs for ad-hoc performance data collection. Once collected, it would then generate a static HTML page with JavaScript charts. I later upgraded HTML charts to a Power BI dashboard as it was more suitable for dealing with the amount of data. The problem with Power BI was that as good as it was at dealing with large data sets, it was slow to load them in the first place. I had a lot of feedback from you SQLWATCHERS, DBAs and SQL Servers folks and you were clear, that you wanted a dashboard that refreshes automatically. I listened, took the feedback, and during the 2020 lockdown, started developing lightweight Grafana dashboards.
Grafana’s dashboard definitions are in JSON, which can be stored in version control together with the rest of the project. Power BI was a binary file, and it was impossible to do the same.
What is Grafana?
What is Grafana, you may ask. It’s (likely) the most popular, free and Open Source dashboarding and data plotting solution. A free copy can be downloaded from their website. You can install Grafana on Windows, Linux, Mac or as a Docker container. You can also run it as a server, so your entire team can access SQLWATCH dashboards, or you can simply run it on your local PC, as a user application when you want to see SQLWATCH data. It is worth to mention that SQLWATCH does not rely on Grafana for any data collection, it is only a presentation tier, so it does not have to run in the background continuously.
Examples
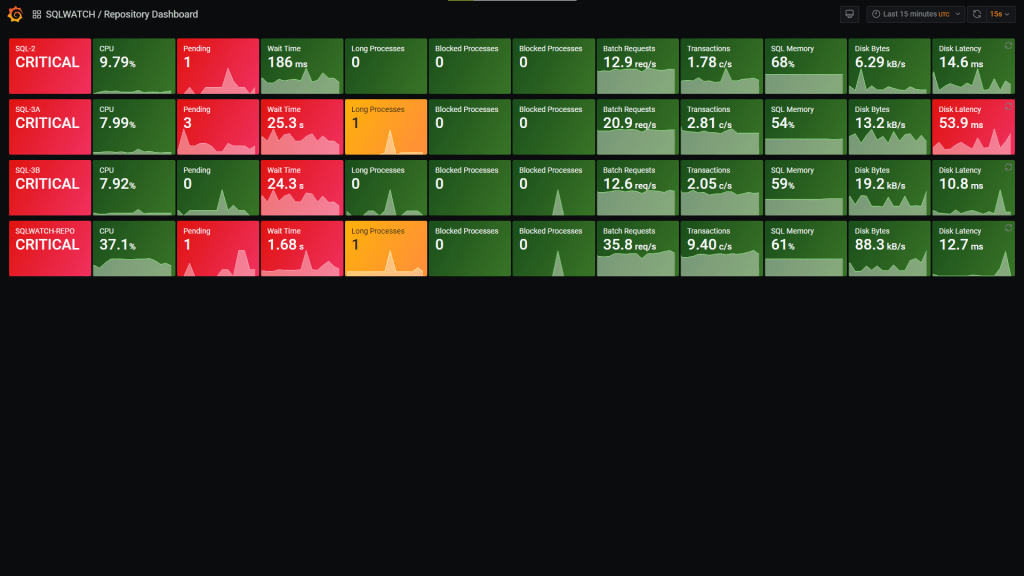
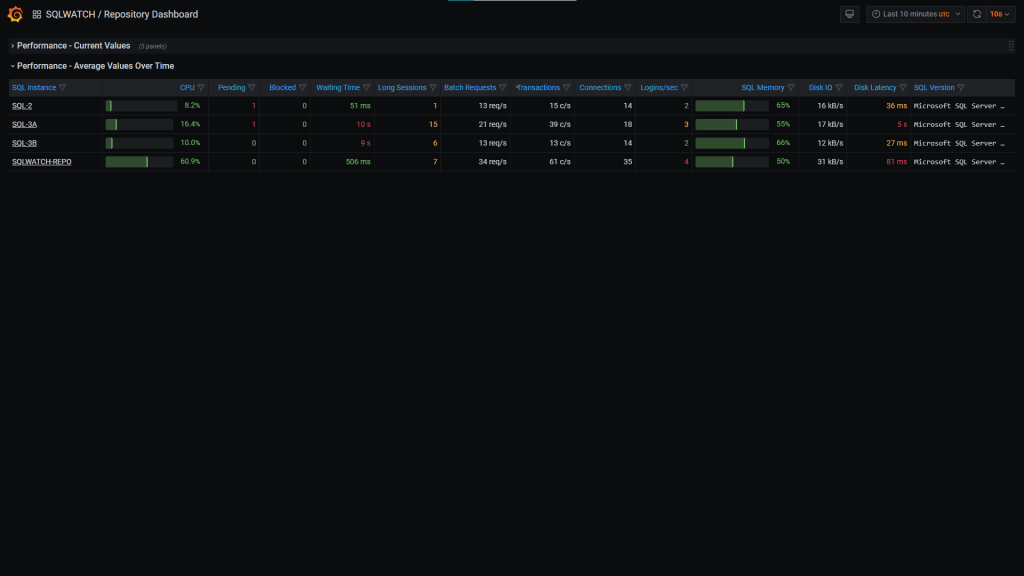
Central Repository dashboard shows all your monitored instances on a single, simple, and clean page where Green, Amber or Red tiles show the state of your SQL Server. In the example below, each row represents a single SQL Instance and shows different metrics. If you have hundreds or thousands of SQL Servers, this could be potentially reduced to a single tile for each server giving you a true overview of the entire estate on a single screen.
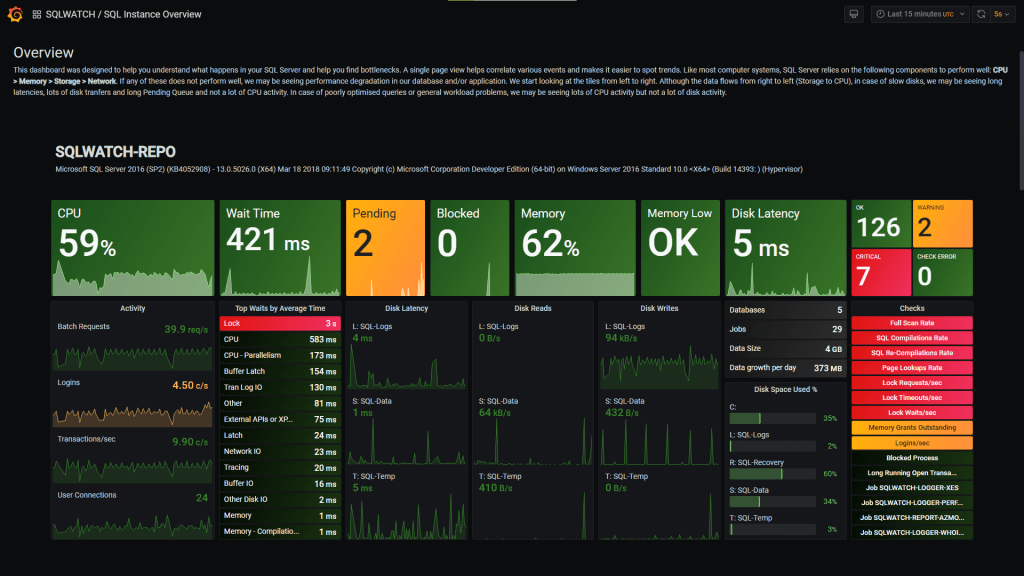
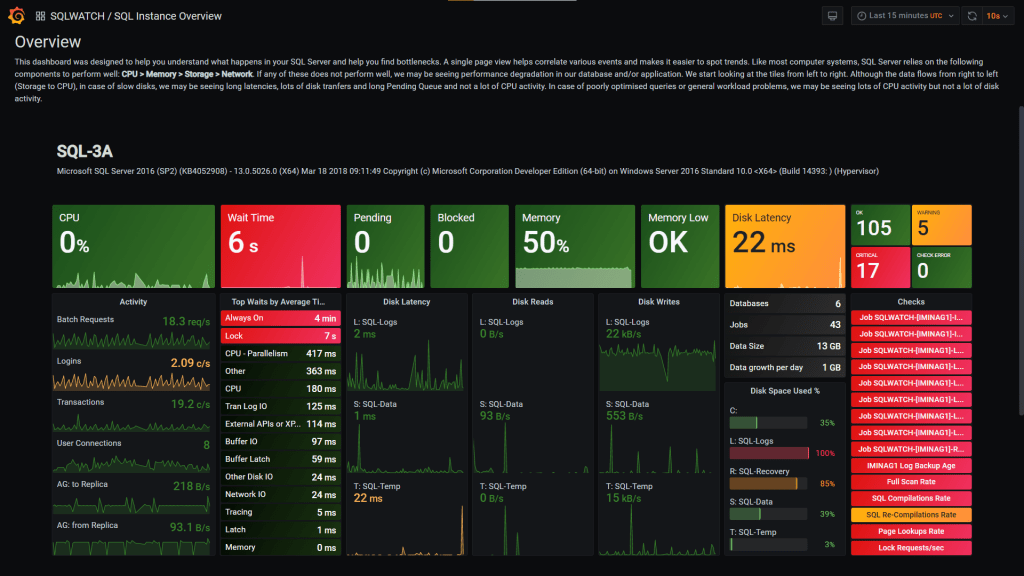
SQL Instance Overview shows detailed information about each SQL Instance. Starting with a dashboard-like overview on the top, focusing on the key metrics:
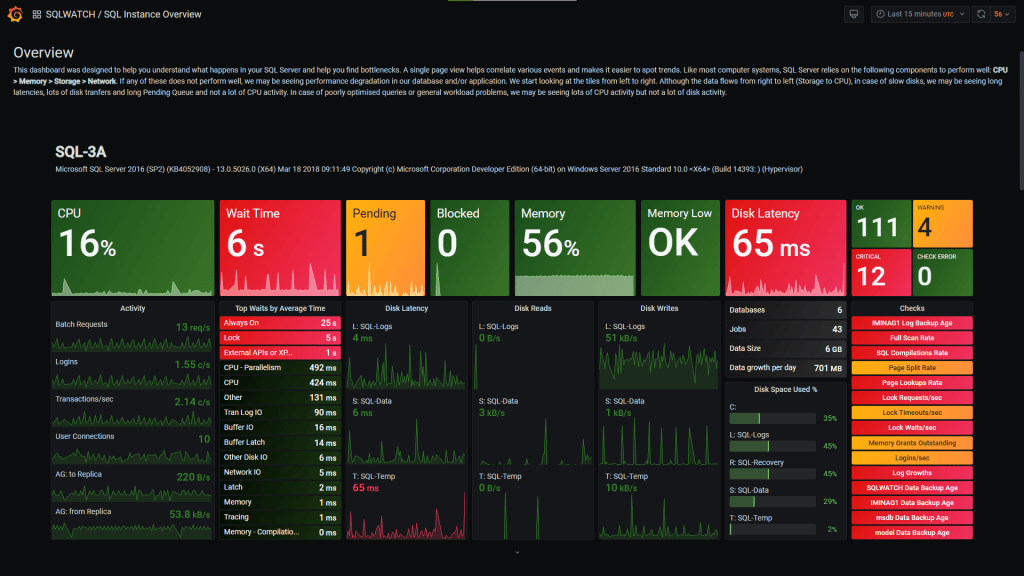
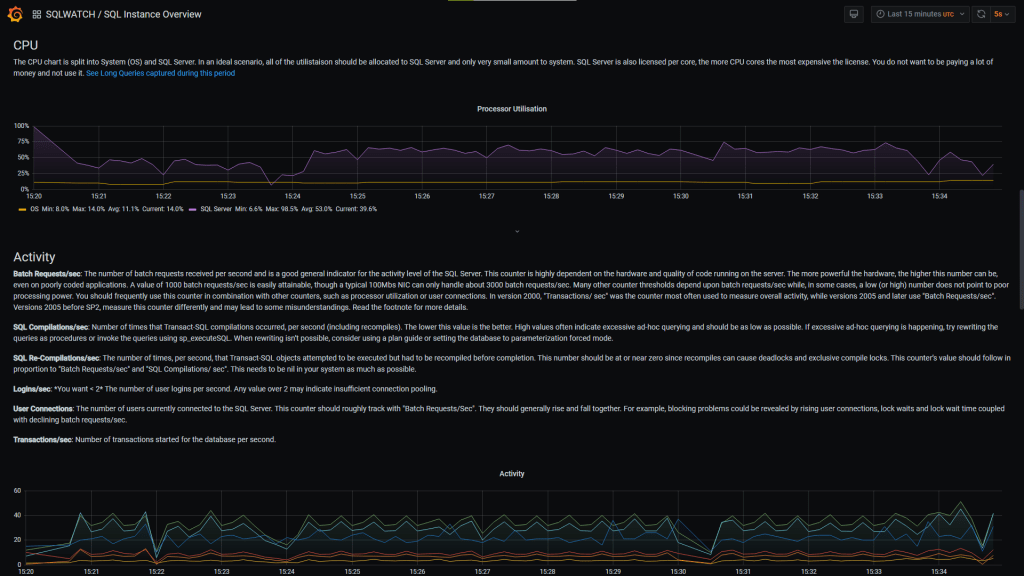
And more detailed charts with an explanation of what each chart shows, to make it easier to understand any performance bottlenecks
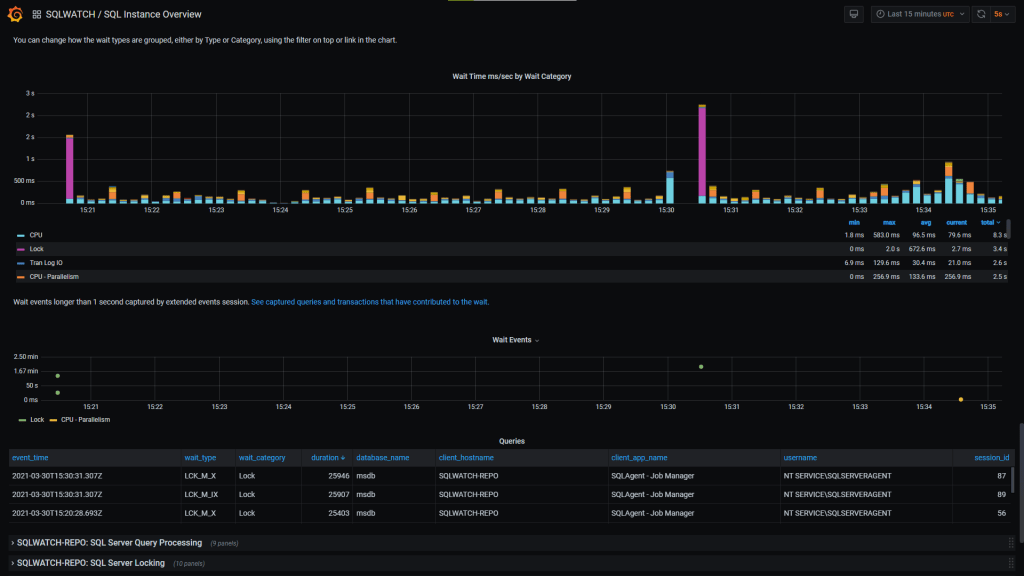
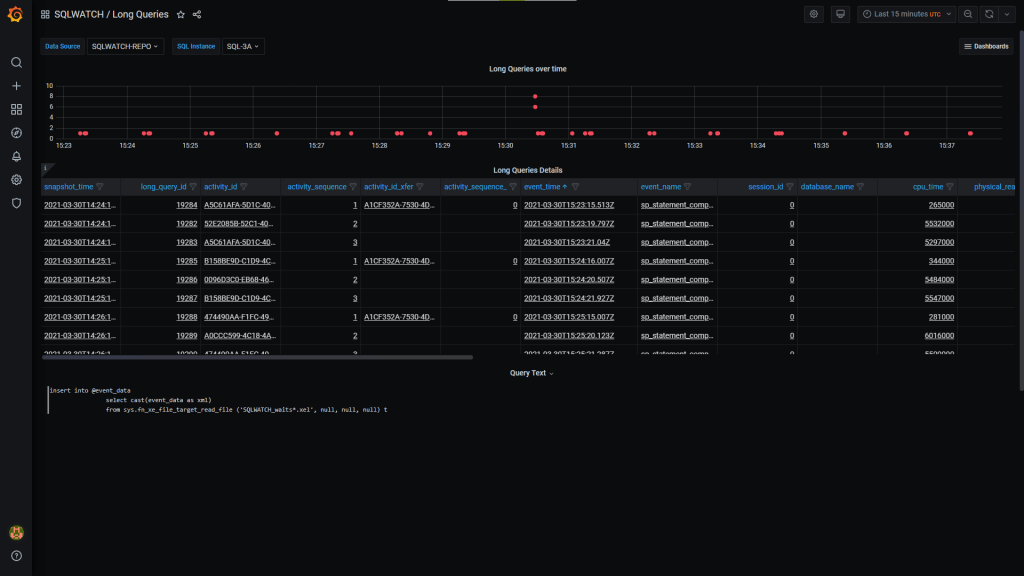
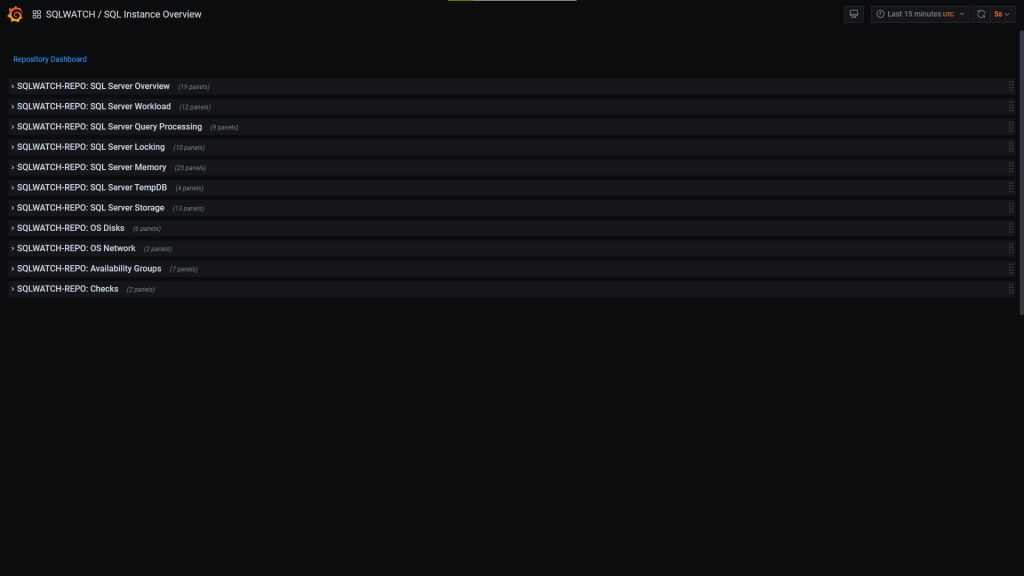
That’s just a small preview. There are many more visualisation available, touching on each area of SQL Server. There is even more to come!
Real-time data collection
Up until now, SQLWATCH was collecting performance data every minute. This was usually enough to understand where the problem was, but not enough to capture spikes or tiny nuances which can contribute to performance bottlenecks. I am explaining more about data granularity in my previous post. My internal tests shown that 5 seconds collection intervals give the most detailed view with no additional performance overhead. However, SQL Agent can run a job every 10 seconds or more, so I had to settle on that for the time being.
One can argue 10 seconds is near-real-time, not real-time. Fair enough, real-time is often in micro or milliseconds but near-real-time can also stretch from seconds to minutes which SQLWATCH already was. Real-time sounds better too!
I am only collecting performance counters and DMVs every 10 seconds. I am not offloading Extended Events from XML – this still happens every minute. This is mainly because processing Extended Events XML can be CPU heavy, so I did not want it to happen very often. As XE sessions collect events as they happen, we do not lose anything, we’re only delaying them on the dashboard. The XES collector has been now split into its own Job.
Availability Group data collection
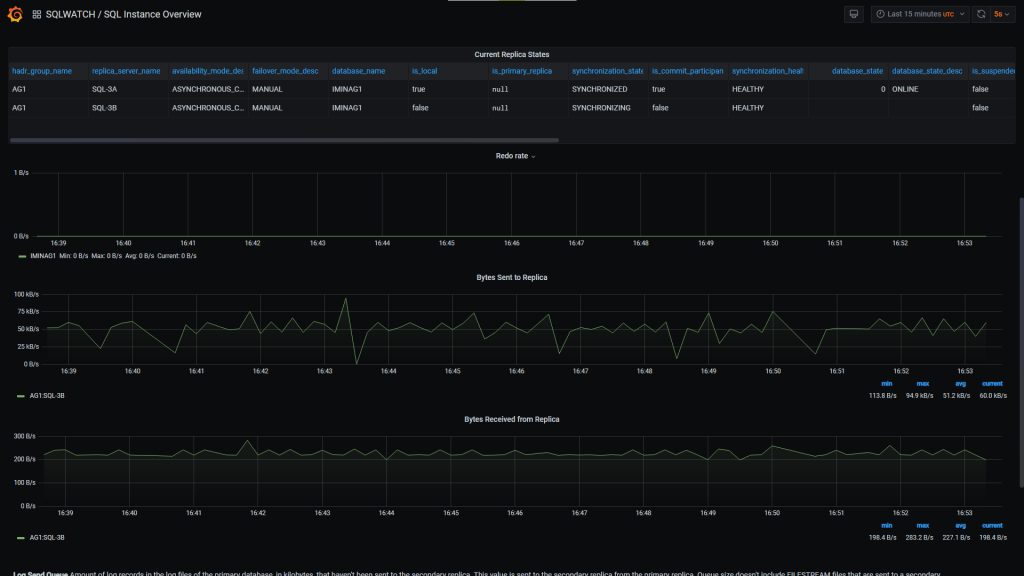
I have added new data collector to collect Availability Groups information and states. You can see it on the Grafana dashboard. AG monitoring will also be expanded in future versions.
Procedures and Query Stats data collection
Although still work in progress, version 3 brings the ability to collect statistics about procedures and queries executed by the SQL Server. The challenge with this collector is about storing the text and execution plans without too much impact on the storage.
Central Repository Collector
SQLWATCH collects data locally, into a local SQL Database. To see the collected data, we must point our Power BI or now Grafana to the said database. This brings challenges for production servers as pulling lots of data, especially large periods i.e. last 2 or 7 days, into the dashboard can have negative impact on the server itself. To address this problem, we can offload data from the production “remote” SQLWATCH database into a central database, designed for this task.
Up until now, I had limited options to achieve this: Linked Server or SQL Server Integrations Services Package (SSIS). Although I did both since version 2.0, I never liked either of them. Each had their own problems that I was not happy with. For example, Linked Servers cannot deal with XML data – yes this is official due to the way Distributed Queries work, they were slow and multi-threading approach was complicated. SSIS on the other hand was fast but cumbersome to maintain.
This all meant that making changes to the schema or adding new data collector also required changes to the SSIS or some tweaks to Linked Servers. Enough was enough and I have written a simple, multi-threaded C# console application to handle SQLWATCH synchronisation. The application is completely meta data driven and does not require any maintenance, it can work out what needs to be imported and does it instantly.
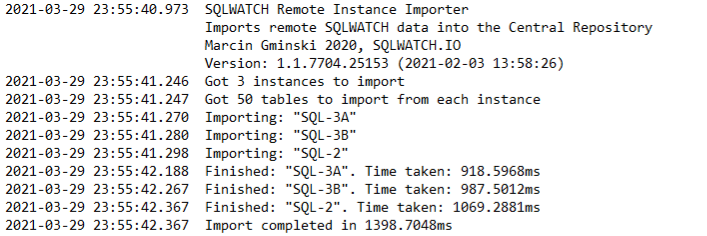
In my tests, I am pulling SQLWATCH data into the central repository every 10 seconds and each run takes about one second for each instance. As the application is multi-threaded, multiple instances are imported at the same time, so the total run of the import is not much longer. The application only pulls deltas (new data) so the more often it runs, the less work it has to do with each run. The below times are on a single core VMs with 2GB RAM.
This is also part of the project under the same license so you can build it from source code yourself instead of running the included executable.
The new Central Repository importer, together with 10 seconds collectors and Grafana dashboards gives us a true real-time SQL Server monitoring.
More flexible checks and templates
In this version I have also improved checks, which can now have templates for Database, Job and Disk. This means that from a single template SQLWATCH will automatically create checks for each Database, Job and Disk. For example, up until now, a check that monitors free disk space would simply return the disk with the least free space. It would then be up to you to go and figure which disk it was. Alternatively, you would have to create a check for each of the disks manually. Quite painful.
select min(free_space_percentage)
from dbo.vw_sqlwatch_report_dim_os_volume
where sql_instance = @@SERVERNAME
and free_space_percentage is not null
Version 3 now has check templates, defined in table [dbo].[sqlwatch_config_check_template]:
select free_space_percentage
from dbo.vw_sqlwatch_report_dim_os_volume
where sql_instance = @@SERVERNAME
and volume_name = '{DISK}'
and free_space_percentage is not null
Which, as you can image, will execute against each disk, rather than just retuning the one with the least free space. Any notifications sent on the back of this check will include the exact disk that’s running low on space.

The same applies to Databases and Jobs. Checks will be expanded and executed in each, respectively.
Future plans and improvements
One problem with running collection via SQL Agent is that each invocation of agent job needs some extra resources. It would have been more efficient to have it running continuously and collect data in time intervals set in the application. Even something as simple as the below:
while 1=1
 begin
     exec dbo.usp_sqlwatch_logger_performance
     waitfor delay '00:00:05'
 end
A continuous approach reduces the number of SQL Logins and User Connections and it’s something I will look at building for the next release.
The same applies to the Central Repository import. In its current implementation, although it’s amazingly fast, it must be invoked every few seconds, which costs additional resources in loading .NET libraries, connecting to SQL, getting meta data and so on. An improved version would be that simply runs in the background and collects new data in intervals.
The problem with continuously running applications are runway resources, memory leaks, unclosed connections as well as making sure when the application is stopped, the data is consistent and that the process does not quit halfway through loading tables. For now, it was safer and easier to simply, invoke, run, and close. That full cycle also ensures imported data is consistent with minimal impact on the server. Next versions will definitely improve in this area.
I hope you will enjoy version 3. You can get it from GitHub. Also, subscribe for updates to be notified when new releases come out.
What will happen to Power BI, SSIS and Linked Servers?
The Repository importer can be invoked from Windows Scheduled Tasks or even as a SQL Agent Job. It’s flexible, fast and does not require any changes when the database changes. With this in mind, I will not be maintaining the SSIS importer anymore and will drop Linked Server mechanism completely in the next version. They are simply too time consuming to fix bugs. This is to ensure you all get the best experience. If you have a reason to keep either of them, please talk to me so we can find a solution for you.
I have no plans to drop Power BI for now. It will exist alongside Grafana and will continue to be aimed at performance tuning and analysis rather than monitoring.
Recent Posts
Want to learn about SQLWATCH?
Marcin Gminski2023-03-28T22:07:01+01:0028th March 2023|0 Comments
SQLWATCH 4.4
Marcin Gminski2022-10-06T15:32:56+01:006th October 2022|0 Comments
T-SQL Tuesday #147 – SQL Server Upgrade Strategies
Marcin Gminski2023-07-06T23:15:07+01:008th February 2022|0 Comments
Should we run SQL Server on the default port 1433
Marcin Gminski2022-03-25T12:40:05+00:007th February 2022|3 Comments
Happy New Year!
Marcin Gminski2022-01-01T18:28:43+00:001st January 2022|0 Comments
I am a Microsoft MVP!
Marcin Gminski2021-12-02T23:15:16+00:002nd December 2021|10 Comments

