How does monitoring affect your server?

The observer effect is a term used in physics and it means that observing a phenomenon changes that phenomenon. Therefore, an object that is being observed, is looking different to the same, not observed object. How is this possible? In physics, this is to do with photons and electrons. An electron is only detected by interaction with a photon, and that interaction changes the trajectory and behaviour of the said electron.
The same applies to many other fields such as electronics, where measuring a voltage of an electronic circuit will have a small impact on the voltage of the circuit itself. Similar informatics monitoring, the performance of a system will slow the said system down. Database monitoring will always have some impact on the monitored instance. In some cases, this impact can spike to as much as 10% – 20%.
Performance impact is not the only impact of monitoring.
What is monitoring and how does it work?
In a very simplified description, we can monitor a system in two ways. We can ask the server or an application “How are you doing?“, “What’s your CPU utilisation?” every few seconds or minutes or we can wait for it to tell us when something bad happens.
Near real-time continuous monitoring
The former is often referred to as real-time or near real-time continuous monitoring and it often relies on querying the monitored system every few seconds or minutes. Furthermore, depending on how we are accessing the monitored system we can further split it into agent-less remote monitoring that will pull data from the remote system and local monitoring that, with a help of a locally installed agent will collect data locally and push it back to the monitoring system or let the monitoring system pull it. Continuous monitoring is ideal for continuous metrics, for example, CPU utilisation or IO saturation.
Agent-less monitoring
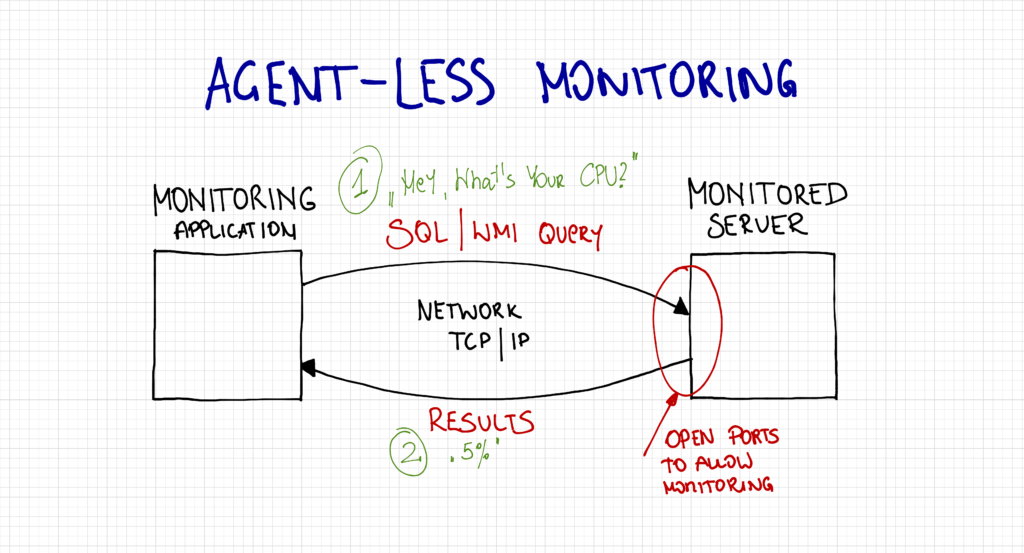
The agent-less monitoring means that the monitoring application communicates with the monitored application or server directly, over the network. The pure agent-less remote monitoring should theoretically be the most efficient as the only impact on the remote server is reading the data out of it. Data manipulation and writing to the storage happen on the monitoring server. However, for pure agent-less monitoring to work, the server must be accessible over the network and have relevant ports open. In case of a Windows-based SQL Server, it will often have to be WMI and the SQL ports which may not have otherwise been opened for the monitoring server.
Apart from the potential security concerns, agent-less monitoring may not work well in complex, multi-subnet network topology and will not tolerate outages between the monitoring server and the monitored instance. We may need one or more monitoring servers per network or subnet.
Agent-based monitoring
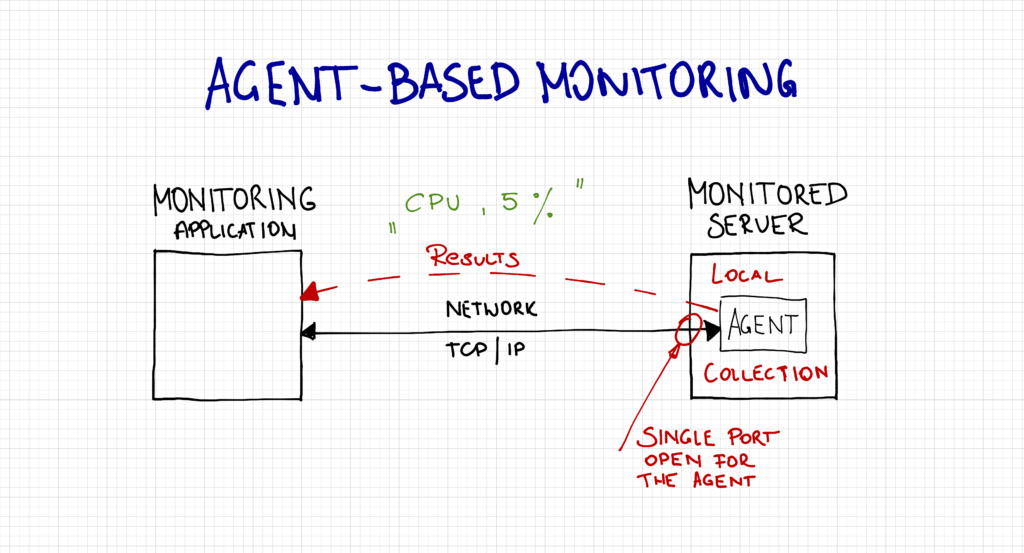
The agent-based monitoring, on the other hand, means that there is an additional application installed on the monitored server. The monitoring application communicates with the agent which does the actual data collection and sends it back to the monitoring application.
This type of monitoring addresses some of the above issues and introduces some more. It may not require the standard WMI and SQL ports but it will require its own ports instead, which does limit the surface area. It will also handle network outages better as it can cache some of the collected data locally. Some agent-based systems, such as the Azure Monitoring do not require inbound ports at all as they communicate outbound, directly with the receiving endpoint. There are also different variations of agent-master communication. Some solutions would engage the agent as a passive proxy where it would simply respond to the request from the master and return the result back and some will have an active agent where it works independently and sends results back to the master on its own. The active agent will also have to check and download a new configuration from the master.
This type may also be more resilient during heavy load as the agent accesses the local resource via shared memory and not the TCP (network) stack.
Both work on the principle that data is offloaded to the monitoring server in near-real-time. Although the agent will have some ability to cache results both will suffer from scalability problems. A single monitoring server can only handle a limited amount of monitored instances. In order to monitor more, we are going to have to scale out or scale up the monitoring server.
Event-driven monitoring
The latter, event-driven monitoring is a different type where the applications “monitors” itself and reports any anomalies. This type usually has to be built-into the application itself, such as SQL Server Extended Events. Another example would be failed tasks or agent jobs. It is the application itself telling us “Hey, something has failed here, you should come and have a look…”. This approach is usually very efficient but not designed to provide continuous metrics.
How SQLWATCH impacts your server
Collection performance
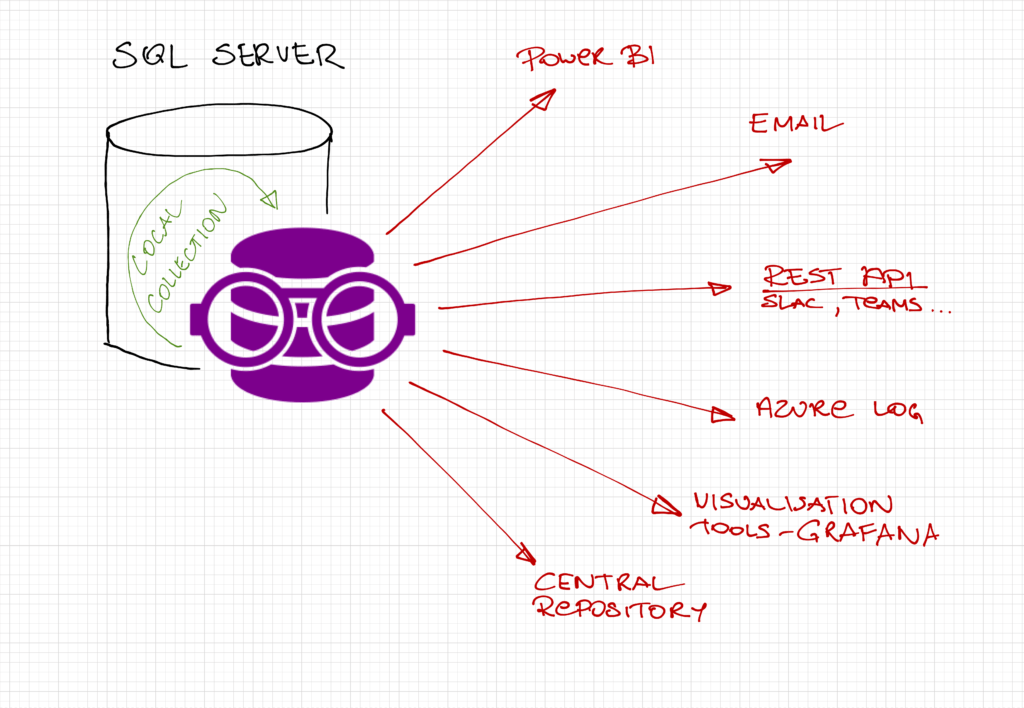
SQLWATCH is a decentralised, local collector. It means that we do not need a central server to manage the monitoring. Each server monitors itself. Data collection is invoked by SQL Server Agent jobs and stored in a local database. It can work in complete isolation and is not network-dependent however, as it stores data on the monitored instance itself, it generates additional load. A lot of effort went into making sure it does not generate too much unnecessary load on the monitored instance. SQLWATCH relies on delta metrics where possible and extended events to minimise the load. It does not rely on server traces.
Events driven monitoring is the most efficient as usually nothing happens until a given event is triggered. For example, we may have an event session to log queries that run for longer than 15 seconds. On a well-tuned system where queries take milliseconds this event would probably never trigger and therefore would not generate any impact.
SQL Server stores extended events in XML format. Parsing XML in SQL Server is expensive and the smaller the XML the better. However, if we make the XE buffer too small, we can start losing information as old events are being replaced by new records. By default SQLWATCH XE sessions store only 100 events which are being offloaded to a persistent table every minute. Depending on how busy the system is this may need tweaking.
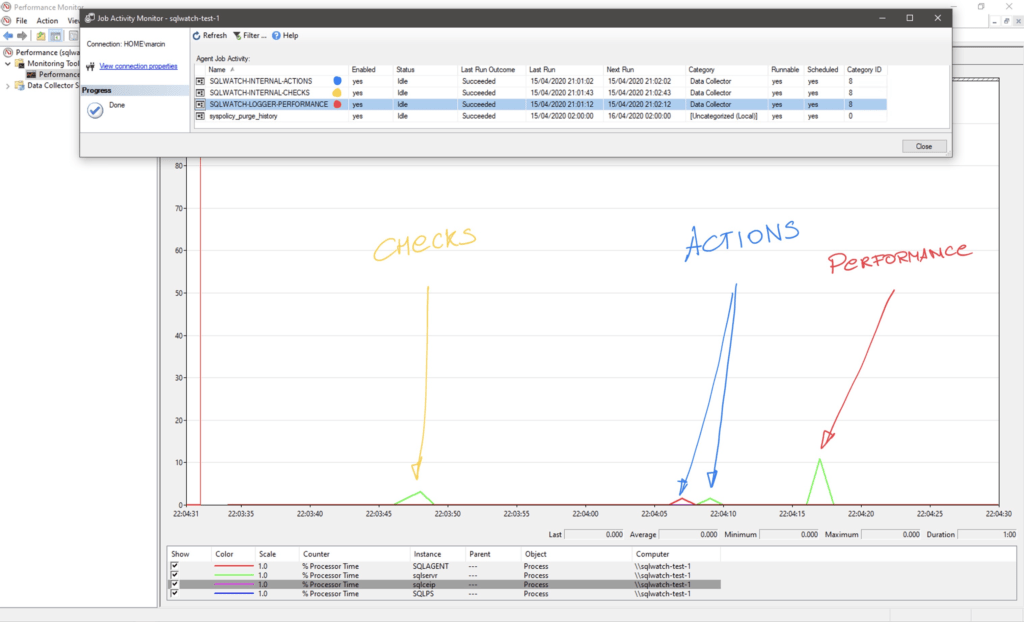
The performance data collection SQLWATCH-LOGGER-PERFORMANCE happens every minute and usually only lasts less than 1 second using between 10% and 15% of CPU on an otherwise idle system. Most of this CPU time is spent on inserting data, ensuring integrity by checking foreign keys and parsing XML.
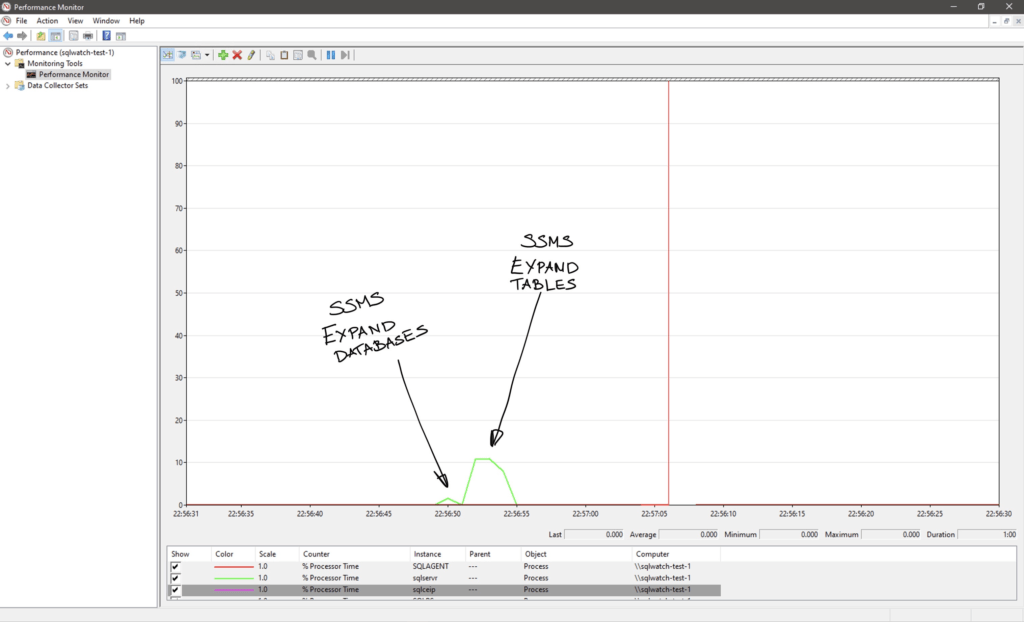
As a baseline, on the same system with all the jobs turned off we can observe the following CPU utilisation when expanding database and its tables in SSMS. Note that this is the CPU utilised by the sqlservr.exe process and not SSMS. When we expand objects, SSMS is querying metadata to obtain a list of object names. This is the impact:
Other collectors, such as disk utilisation and index statistics will require more resources but also run less frequently. You may have to find the best time slots for each collector if the default timing clashes with the actual workload.
Reporting performance
As we have already established, SQLWATCH keeps collected data on the monitored instance. This means that running the included Power BI dashboard will read data from the monitored instance. Although I have normalised the schema and generally tried to make it as efficient as possible with a minimum footprint, depending on the parameters and the range selected it could have a significant performance impact.
I do not recommend querying production instances into Power BI frequently or with wide date ranges.
Central repository
Although the concept of SQLWATCH is a decentralised collection by design, the reporting can be done centrally. You can mitigate reporting impact by offloading data into the central repository. I have designed the central repository to offload data very frequently, in fact, the more frequently it runs, the less impact it has on the monitored instance as it mainly relies on deltas. The central repository also allows to reduce the amount of data stored on remote instances and thus improve their performance. This approach will turn SQLWATCH into almost agent-like monitoring with minimum data stored “cached” on the monitored instance.
Checks and alerts
Whilst it would probably be possible to implement a true or close to true event-driven monitoring with the help of the Service Broker, such solution would add a lot of complexity. I tried to keep SQLWATCH simple and efficient and this means trade-offs. Since version 2.2 it is now possible to create alerts. “Checks” are very lightweight queries that run every few minutes and check for critical metrics. They can trigger actions and send notifications if the check result is breaching the set threshold.
This is important as it allows two things to happen:
- Reduce the use of the dashboard and thus reduce the querying and the load on the server.
- Free up your precious DBA time to do more important things than checking the dashboard every few minutes.
Actions
SQLWATCH also comes with actions that allow to process the collected data and, for example, push to Azure Log Monitor where it can be queried without any impact on your production environment.
Third-party integrations
SQLWATCH provides data normalised and pre-calculated data sets (facts and dimensions) which can be fed into almost any visualisation tool or existing availability monitoring solution.
Future improvements
I am constantly looking for improvements and currently focusing on improving the XML parsing.
I am also analysing the impact of referential integrity. There is no doubt that RI can degrade performance, in the end, the SQL engine has to do more work to insert or update data, but so far I have not enough evidence how significant this impact is in SQLWATCH.
Conclusion
SQLWATCH utilises a simple concept of decentralised local monitoring. We can run data collection via SQL Agent, Windows Task Scheduler or any other scheduling tool. It can work in total isolation and does not rely on network access for data collection. We can also further limit the impact on the monitoring server by offloading data to a central repository.
Remember, SQLWATCH is Open Source and you are more than welcome to help improve it. Please get in touch if you find any performance issues or have ideas for improvements.
This post was originally published on 21st April 2020.
Recent Posts
Want to learn about SQLWATCH?
Marcin Gminski2023-03-28T22:07:01+01:0028th March 2023|0 Comments
SQLWATCH 4.4
Marcin Gminski2022-10-06T15:32:56+01:006th October 2022|0 Comments
T-SQL Tuesday #147 – SQL Server Upgrade Strategies
Marcin Gminski2023-07-06T23:15:07+01:008th February 2022|0 Comments
Should we run SQL Server on the default port 1433
Marcin Gminski2022-03-25T12:40:05+00:007th February 2022|3 Comments
Happy New Year!
Marcin Gminski2022-01-01T18:28:43+00:001st January 2022|0 Comments
I am a Microsoft MVP!
Marcin Gminski2021-12-02T23:15:16+00:002nd December 2021|10 Comments

