Monitoring is personal. Don't settle for standard dashboards.
Performance and database health are everyone’s responsibility. SQLWATCH is a very versatile Microsoft SQL Server monitoring solution that gives DBAs, DevOps, SREs and Engineering teams eyes on performance, security, and configuration to troubleshoot faster and easier, with out of the box, real-time dashboards and regular health checks.
24/7 Monitoring and Observability
Reduce costs
Reduce SQL Server license and infrastructure costs. Reduce Administrative hours spent on monitoring, reporting, and analysis. Reduce license costs associated with expensive monitoring tools.
Reduce risks
Reduce uncertainty
Gain insight into every aspect of SQL Server and never be in the dark regarding configuration, performance, and management.
Increase visibility
Accelerate application deployment by monitoring every aspect of your SQL Server with dashboards relevant to each team and business unit.
Triage and Remediate
Security & Compliance
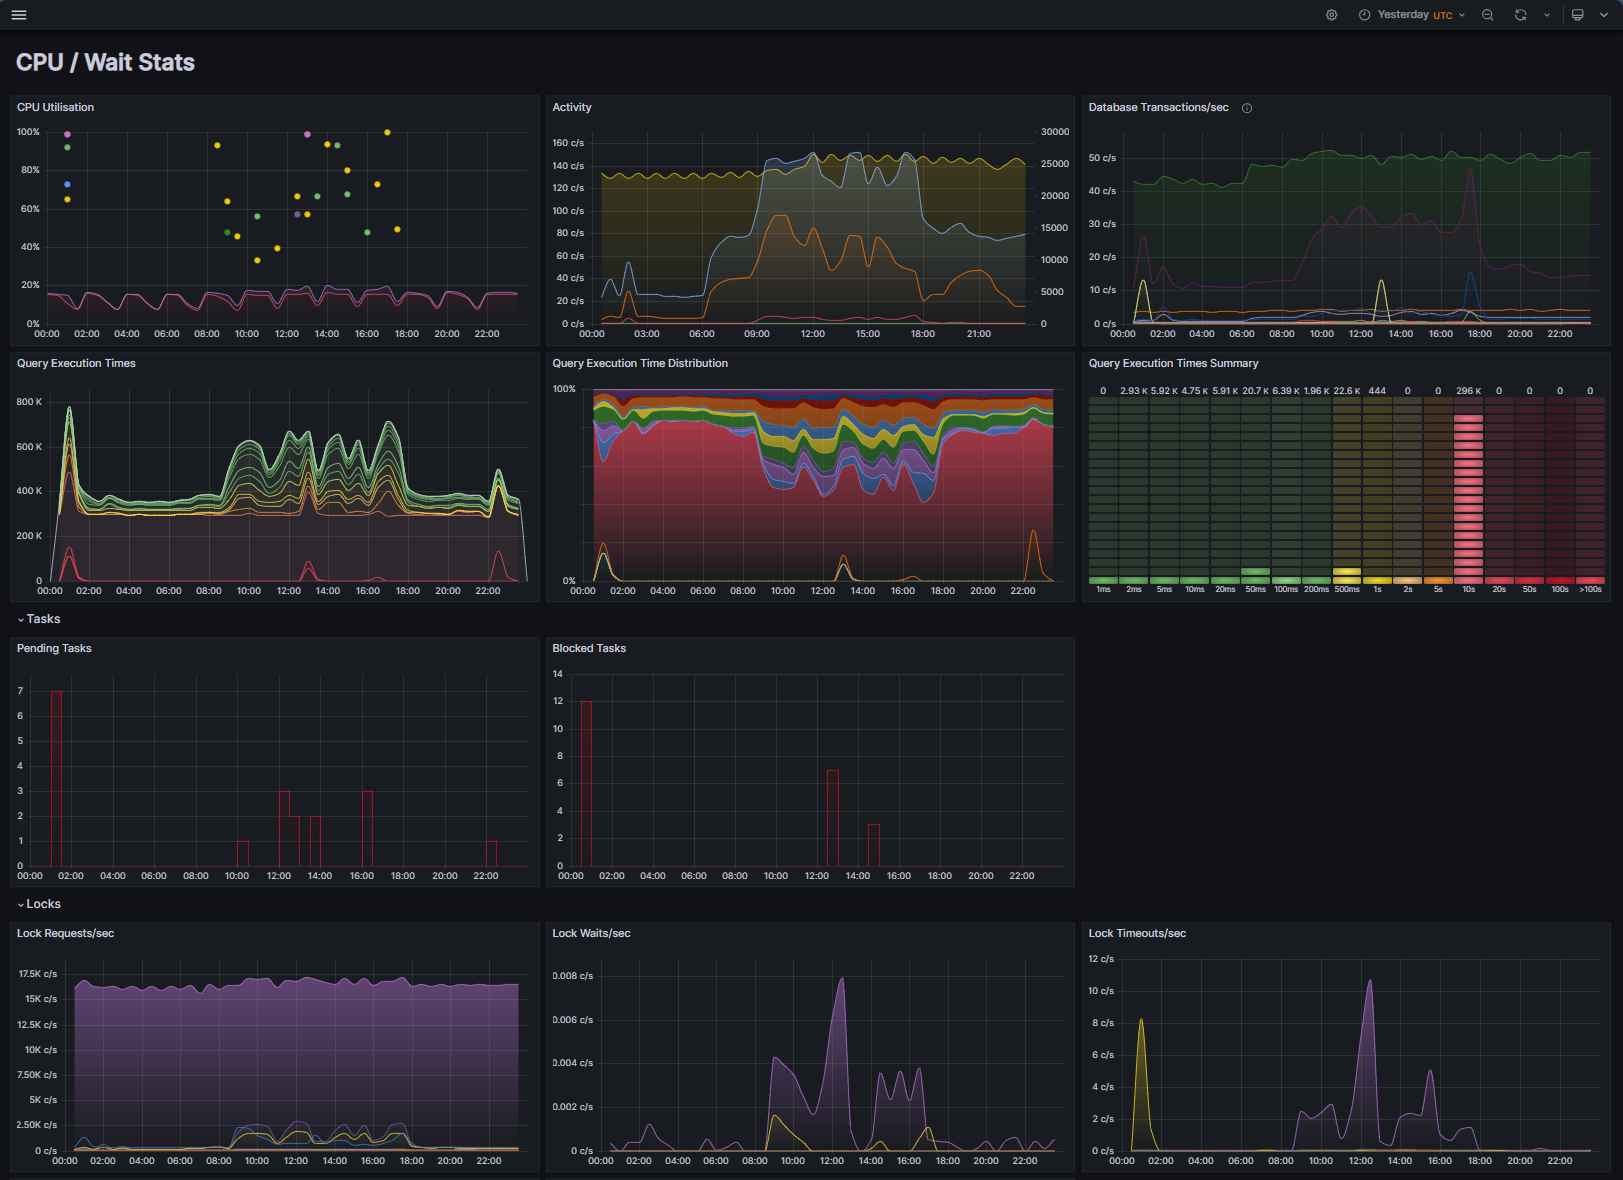
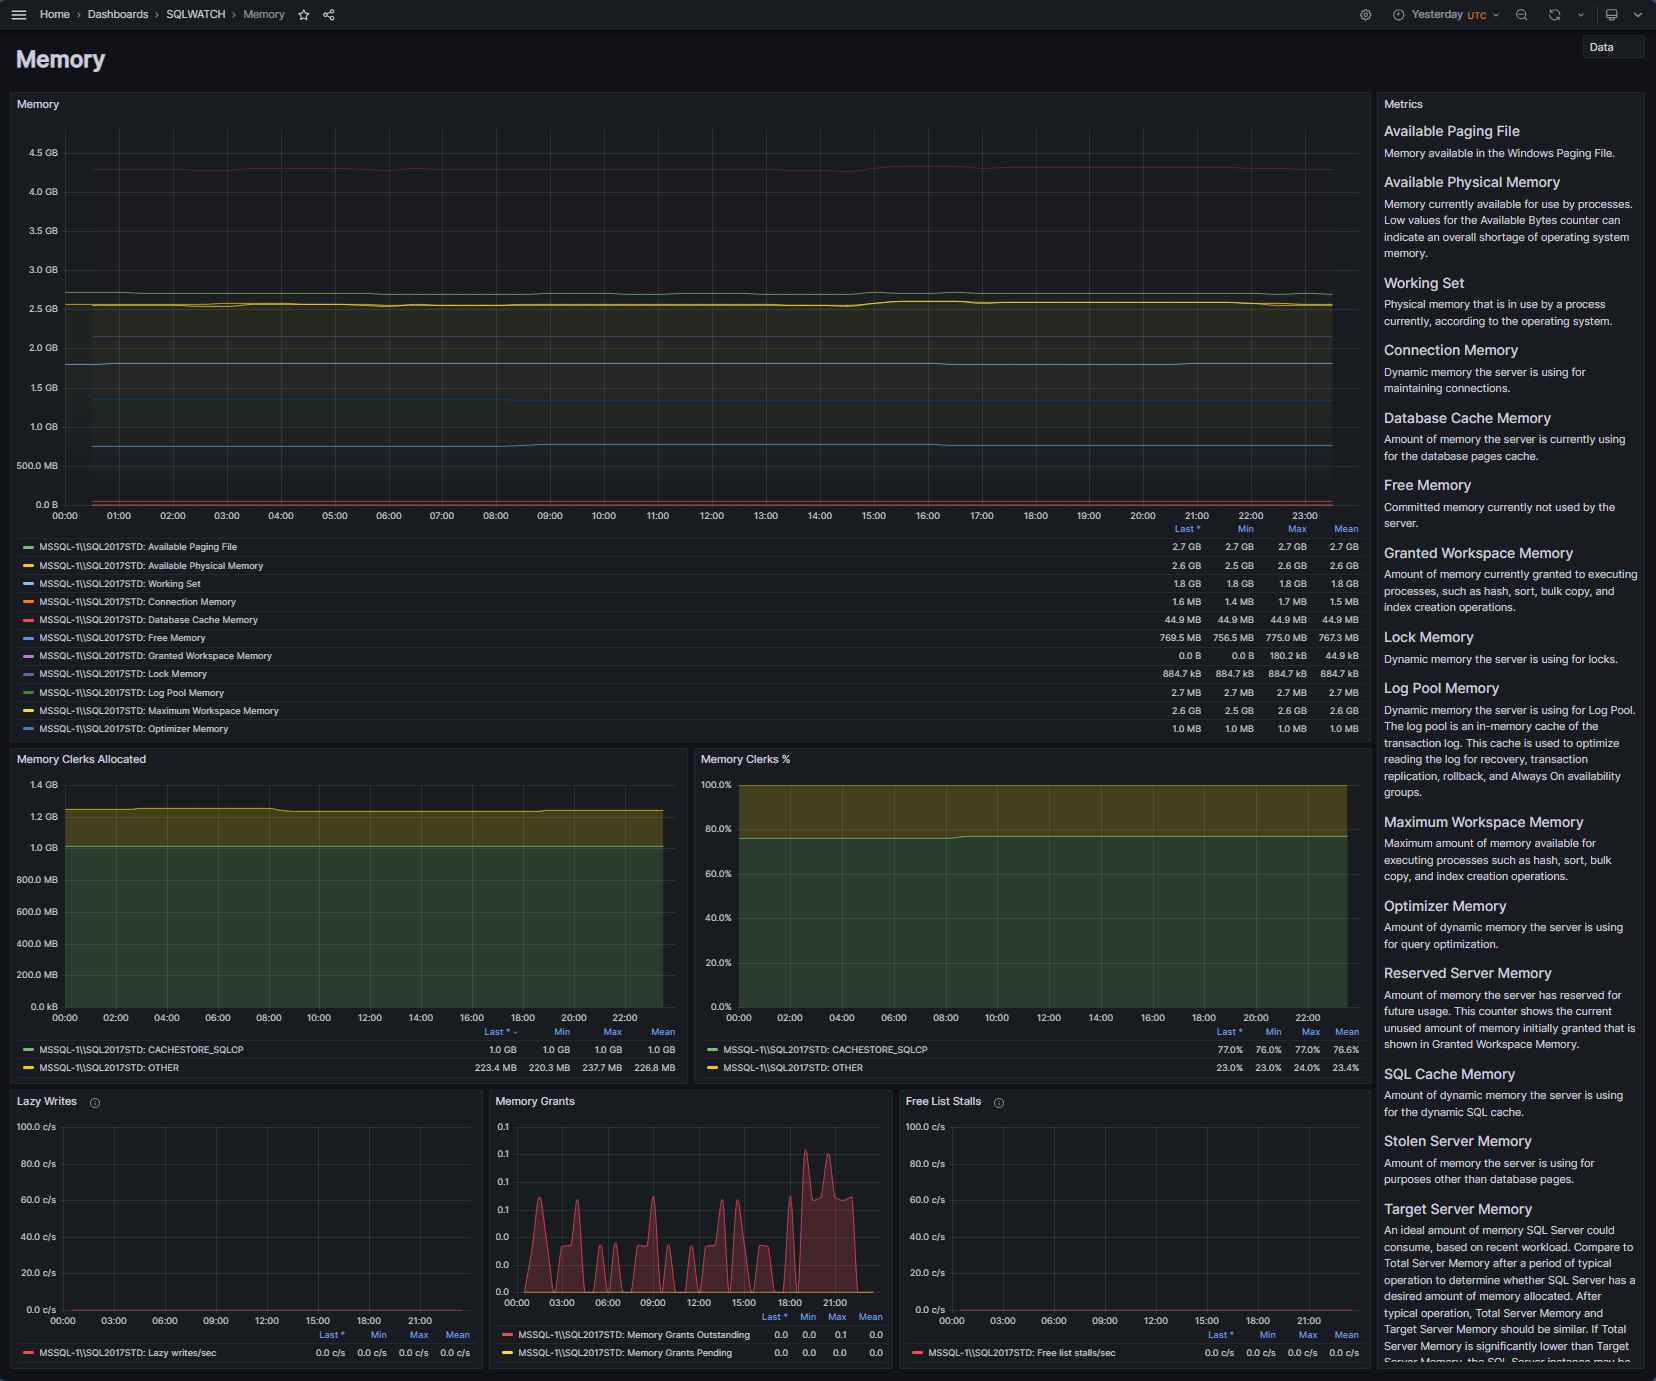
Performance Data
Collects performance data for issue solving, debugging, trend analysis, performance optimisation and cost reduction.
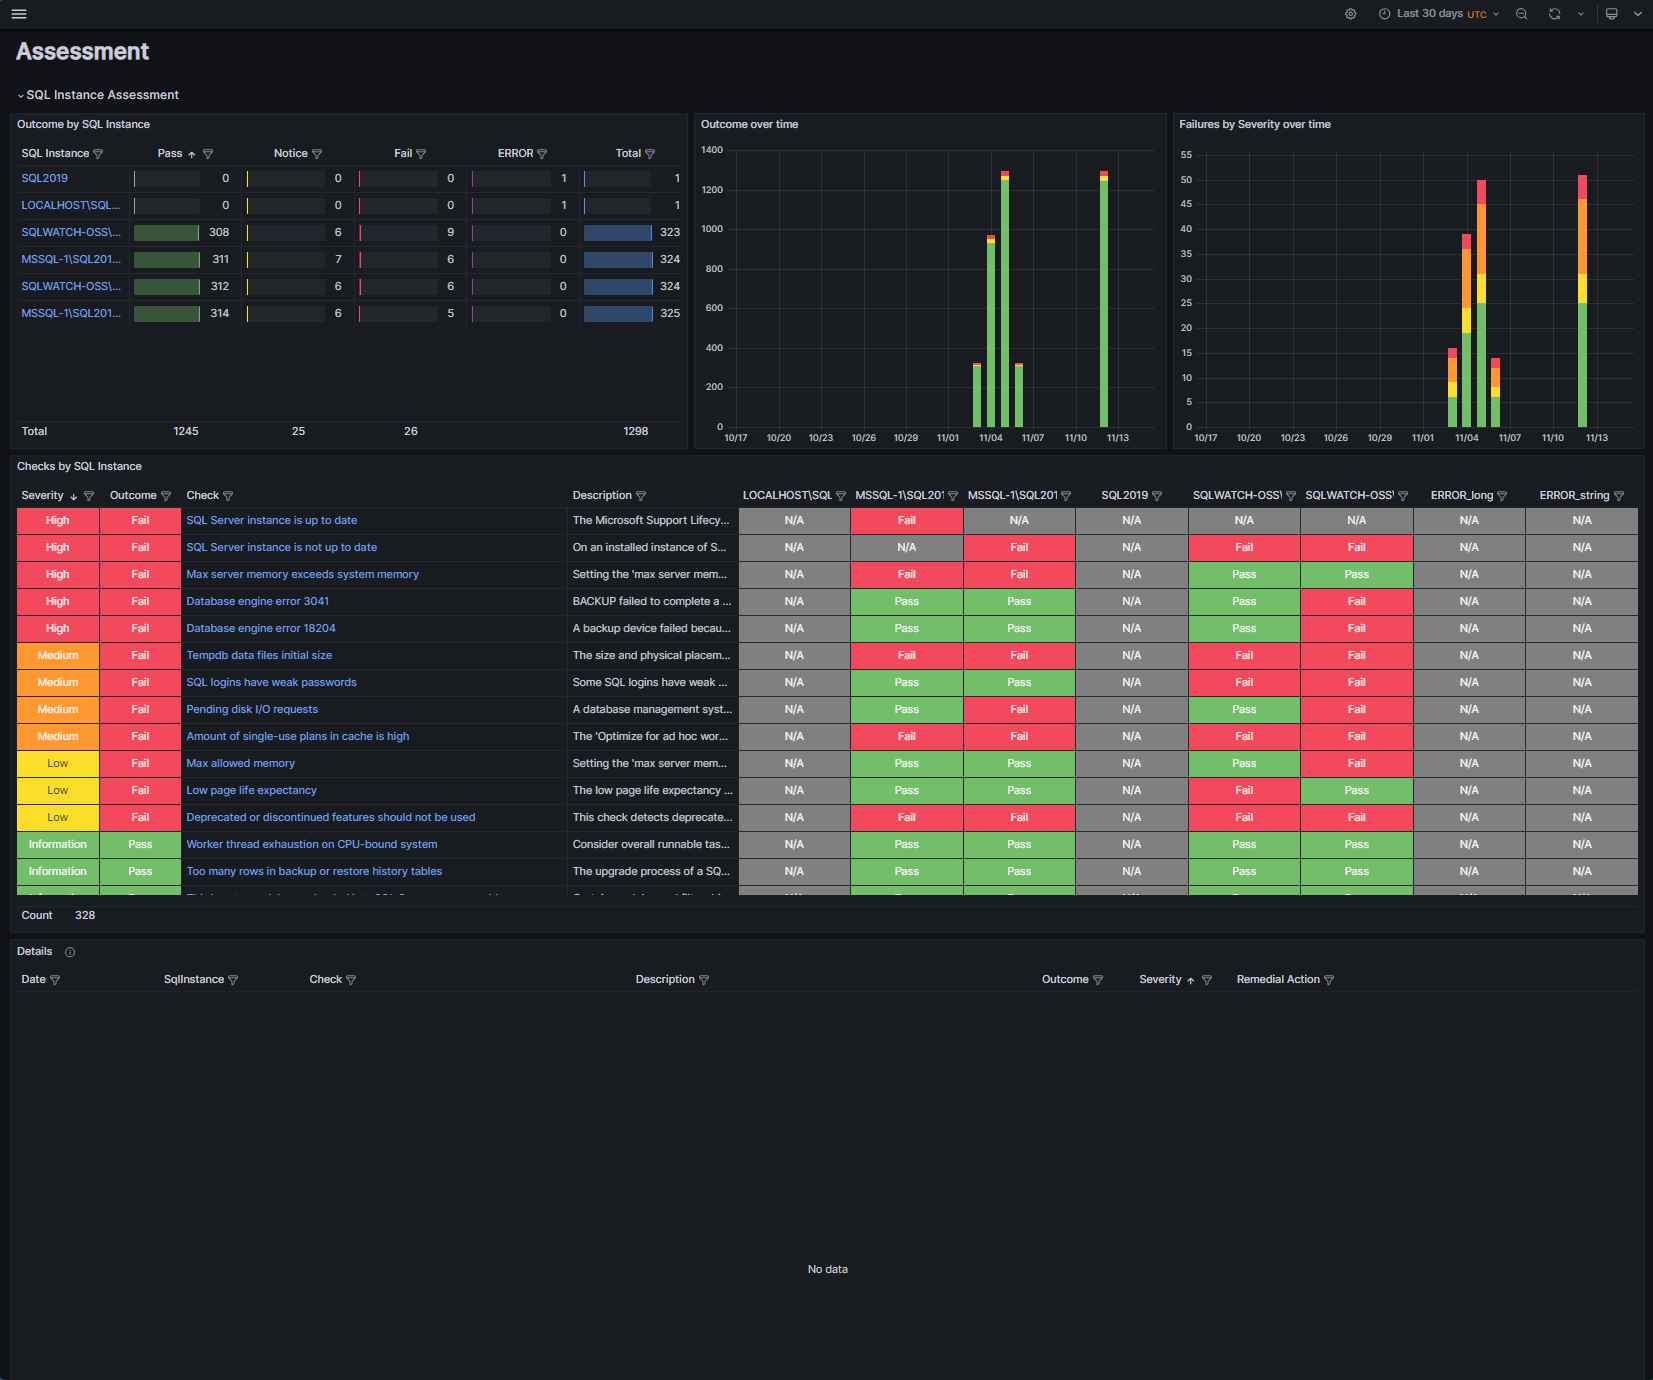
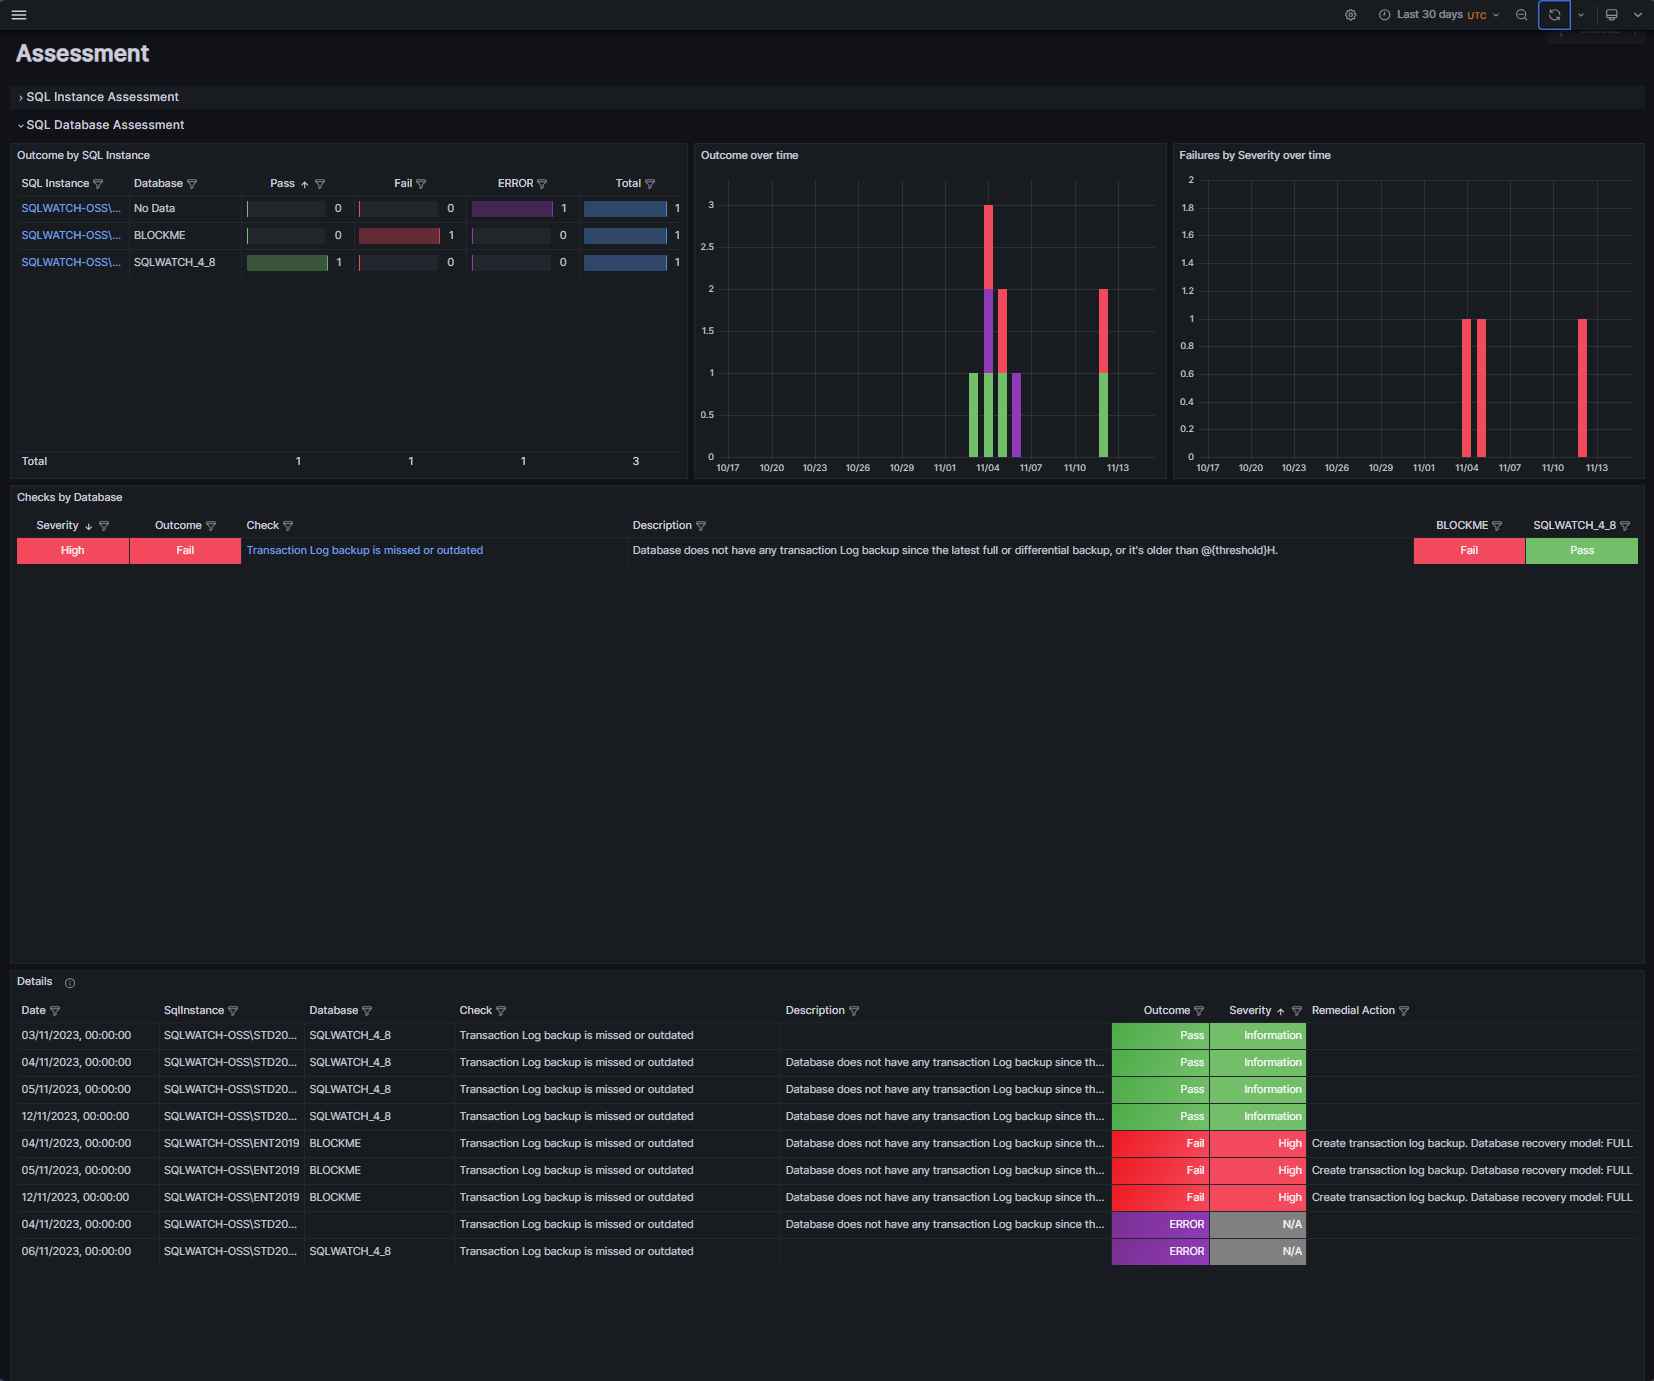
Configuration Audit
Tracks configuration changes and provides configuration recommendations based on your actual workload.
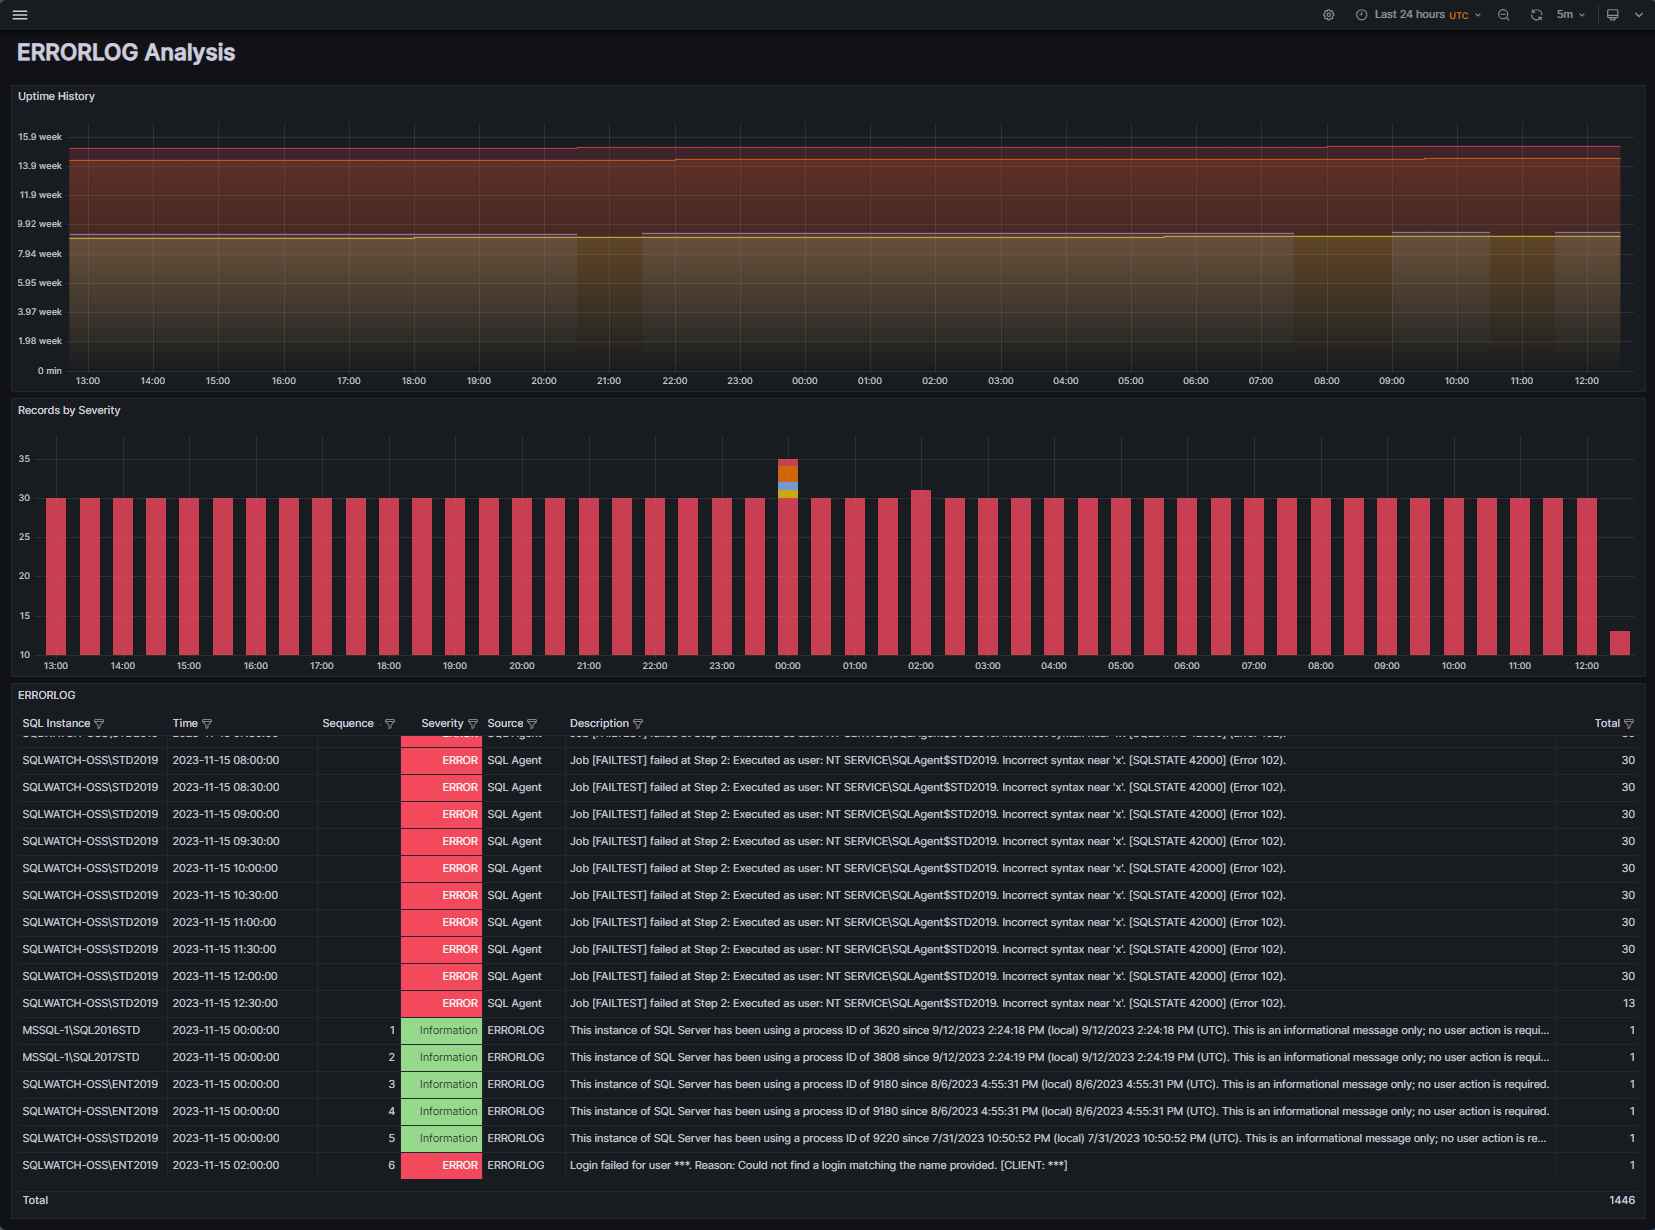
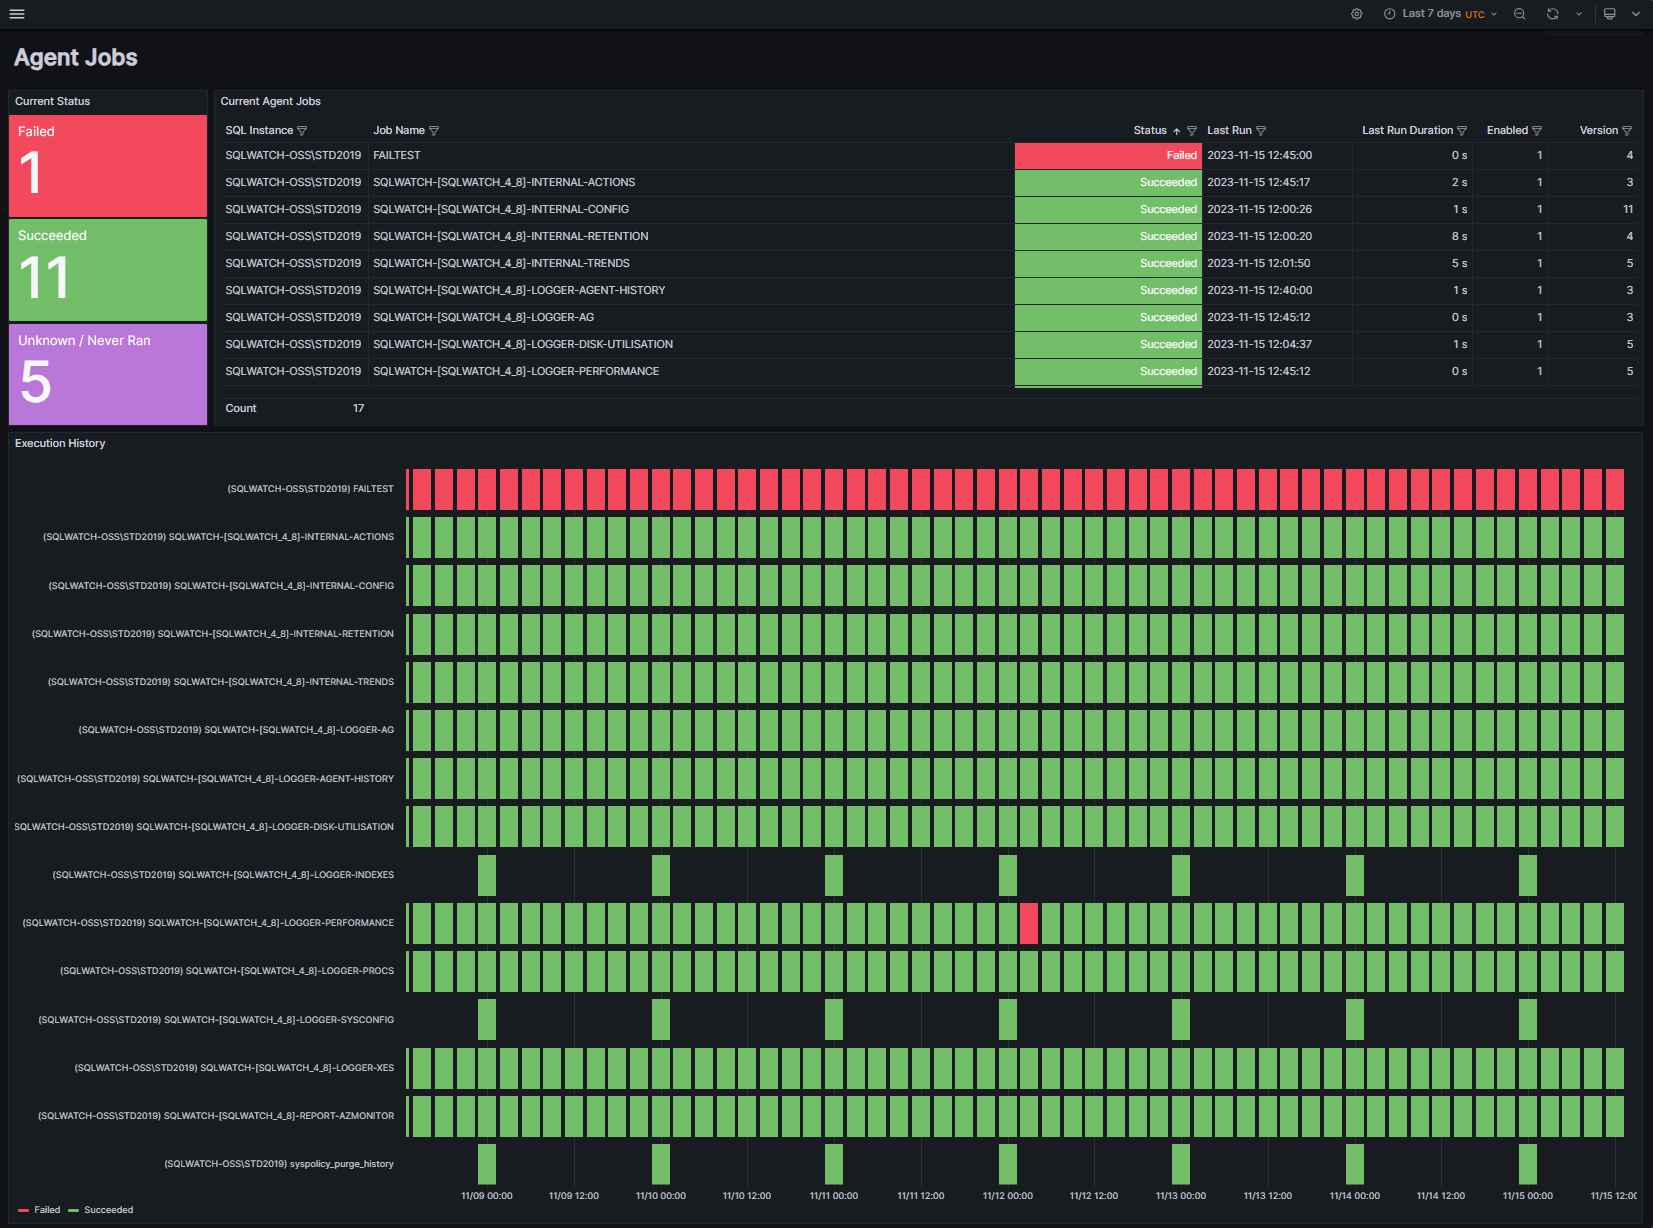
Issue tracking
Our API collects and analyses SQL Server’s ERRORLOG and provides insight into security, performance and stability issues.

Make your SQL Servers green(er).
Database servers consume a lot of energy, which results in CO2 production. Most data centres offset substantial amounts of CO2, and we have already used an Eco-Friendly Data Centre for SQLWATCH Cloud, so our carbon footprint has already been minimised.
However, we want to do more. We actively contribute a portion of our revenue to carbon removal.
Pricing
The Open-Source version will always be free and is licensed under the MIT license.
Download the latest Open Source version from GitHub.
Frequently Asked Questions
We are a UK business located in the beautiful City of York, specialising in SQL Server and Azure. We help companies run their SQL Server platforms, and we’d like to think we know a thing or two about SQL Server. We have been in the SQL Server business for over 20 years.
SqlWatchCloud has been designed with security in mind. We use PowerShell to collect data from your SQL Servers for complete peace of mind and transparency. The data is submitted to our secure API where we “make sense out of it”. This way, you can see exactly what is going on. You only need to install it on a single Windows Server, and it will collect data from all your SQL Servers.
A workspace is your private space where your data and dashboards are.
Currently you can not, but we plan to implement this soon.
We are here to help! Contact us via the online portal, and we will sort things out for you!
We would like to work with you to ensure you get what you need. However, we understand you may not like the product. In that case, you can cancel anytime, and we will delete your entire workspace from the production system and any backups. There won’t be a way back to recover it. Ever.
Yes! Get in touch so we can discuss details.
No. However, like most SaaS platforms, this service too has its limits. Based on our experience, we expect a single server will require approximately 1GB of space for monthly data monitoring. We may discuss different options with you if you have a server requiring considerably more data (for example, if you have thousands of databases and thousands of data files), or if we want to run higher frequency or more metrics.
MSP pricing is a starting point and can be expanded to suit your business needs. Let’s chat so we can find out what you need.
The Cloud version is not just hosted SQLWATCH Open Source. The Cloud version has been redesigned from scratch to be more efficient, faster, and flexible. All you need is a PowerShell module to collect data from all your company servers. SQLWATCH Cloud has been designed for those who do not want to do “DIY” Open Source and want 100% reliable, hassle-free monitoring that works. The overhead has been reduced to almost zero compared to the SQLWATCH Open Source.
We agree that “cloud” is not the answer to everything but sometimes it makes sense. We want to make sure SQL Server monitoring is affordable, easy to use and flexible. We can only achieve this through clever automation and sophisticated cloud-native architecture, which would not be easy or impossible to attain on-prem at a low cost.
SQLWATCH is a dedicated SQL Server monitoring solution designed by SQL Server DBAs with low costs and high flexibility in mind. It is significantly cheaper than other tools and comes with DBA support. Monitoring is personal; SQL Developers want to see metrics different from SQL DBAs and the Business. SQLWATCH enables you to build custom dashboards specific to each department so everyone is always on the same page. You can also tap into the API and integrate collected data with other data or your tools.
Currently not. Due to the significant difference in architecture, migration is not possible, but this is something we would love to implement, so watch this space.
Your platform. Your needs.
Have a custom shopping list?
Need longer retention period, more alerts, or something else?
Have only 1 server to monitor, or 2000 servers? Standard plans don’t cut it?
Let us know what you need. We designed SQLWATCH Cloud to be as flexible as possible and we’re sure we can meet your demand.

